
Industry Knowledge Hub

Garment Manufacturing Insights

Stay Updated with Apparel Sourcing, Textile Innovations & Export Trends

0%

Choosing the right Apparel Export House is not simply a price comparison. Global buyers need dependable quality, documented compliance, and production visibility. The scale of this responsibility is significant. The International Labour Organization estimates that more than 60 million people work in the garment industry worldwide. Each purchase decision can affect factories, workers, communities, and brand reputation.

Material decisions also require sharper attention. Textile Exchange’s Materials Market Report 2024 states that global fiber production reached approximately 124 million tonnes in 2023. It projects production may rise to 160 million tonnes by 2030. This growth increases pressure on exporters to manage fabric sourcing, recycled content claims, waste, and traceability. A capable export house should provide test reports, approved samples, inspection records, and clear shipment schedules. Small details matter. Think of shade bands, carton labels, needle detection, and sealed packing lists.

The best partner is not always the largest supplier. It is the one that can repeatedly meet measurable standards across seasons. WTO trade data also shows how deeply clothing connects with global merchandise trade, making logistics planning and market knowledge essential. Buyers should examine certifications carefully and verify their scope, validity, and issuing bodies. A polished brochure is not proof. No supplier is flawless. However, reliable exporters acknowledge production risks early and offer practical corrective actions. This introduction examines what separates a credible Apparel Export House from a merely attractive sales presentation, using industry evidence, buyer expectations, and operational experience as reference points. Claims need evidence. Safety, consistency, and honest communication remain the real foundation of global apparel sourcing.
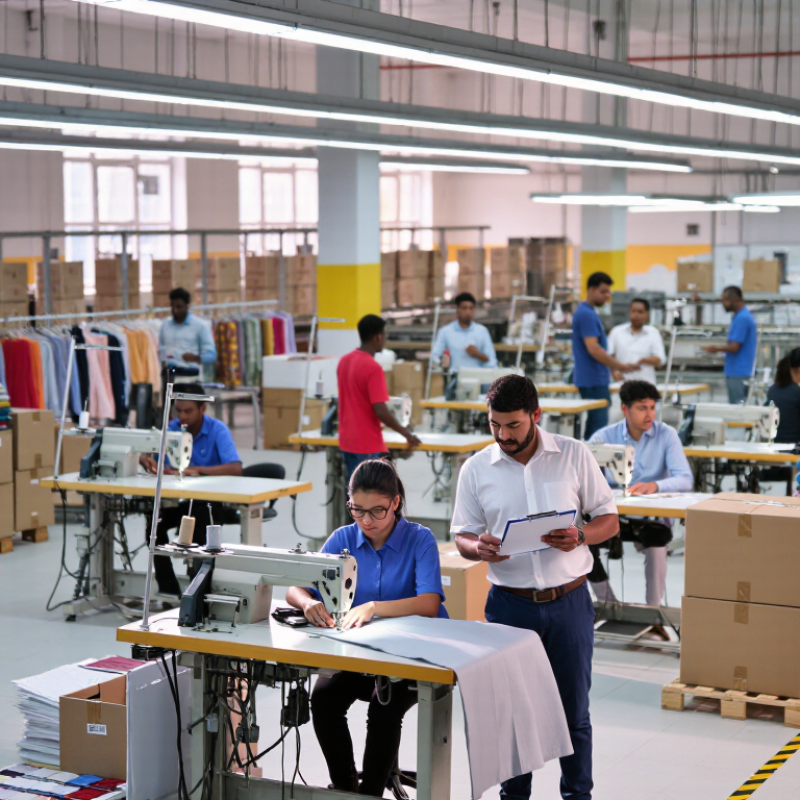
Top Apparel Export House for Global Buyers?

Defining an Apparel Export House Through WTO Product Classifications

Top Apparel Export House for Global Buyers?

Defining an Apparel Export House Through WTO Product Classifications

A credible apparel export house should be measured by product evidence, not polished factory photographs. The WTO commonly separates apparel through Harmonized System categories. HS 61 covers knitted or crocheted garments. HS 62 covers non-knitted garments. HS 63 includes other made-up textile articles.

This distinction matters during supplier screening. A factory producing woven trousers may not have the right machinery for knitted sportswear. Needle type, fabric weight, seam strength, and shrinkage testing can differ sharply. The WTO World Trade Statistical Review 2024 places global clothing exports at approximately US$550 billion in 2023. That scale shows opportunity, but it also increases classification risk. A product described as “apparel” remains too vague for serious sourcing.

UN Comtrade data provides another useful check. Buyers can compare HS 61 and HS 62 export values by country, then review shipment consistency. I would also request recent test reports, production records, and a sample matching the declared HS code. Small details matter. A collar can expose poor control.

There is an uncomfortable weakness here. HS codes describe traded products, not factory capability, ethical performance, or delivery discipline. Two exporters may use the same code while offering very different workmanship.

Therefore, a reliable evaluation combines WTO classification data with physical inspections, laboratory testing, and documented corrective actions. Numbers help, but they do not sew the garment.

Mapping Global Clothing Trade with WTO and UN Comtrade Export Data

Global clothing trade is best mapped through customs data, not promotional claims. The WTO reported world clothing exports of about US$576 billion in 2022, while textile exports reached roughly US$339 billion (WTO, World Trade Statistical Review 2023). These figures show the scale of the sector, but they do not identify one universal “top apparel export house.”

UN Comtrade records, grouped mainly under HS 61 and HS 62, place China at roughly US$182 billion in clothing exports in 2022. Bangladesh and Vietnam each recorded about US$45 billion, although totals vary by product definitions and reporting practices. A warehouse in Dhaka may show thousands of packed cartons, while the database shows only customs value and destination.

Data needs careful handling.

Export value is not factory capability. It can reflect imported materials, processing arrangements, exchange rates, and shipment timing. WTO statistics improve international comparability, while UN Comtrade offers detailed country and product-level records. Yet mirror statistics can differ between exporting and importing economies. That gap deserves attention. A reliable buyer should compare HS codes, year, destination, unit value, and shipment volume before judging supplier strength. The largest exporter may not provide the best lead time, compliance evidence, or production flexibility. Trade data offers a strong map, but field verification remains essential. (Sources: WTO, 2023; UN Comtrade database.)

Top Apparel Export House for Global Buyers? – Mapping Global Clothing Trade with WTO and UN Comtrade Export Data

Major apparel-exporting economies ranked by combined exports of knitted and non-knitted clothing

Reference year
2022
Product coverage
HS 61 + HS 62
Trade flow
Merchandise exports
Currency
US$ billion
Rank Exporting economy HS 61: Knitted clothing
US$ bn
HS 62: Non-knitted clothing
US$ bn
Combined apparel exports
US$ bn
Share of listed exporters Buyer-market profile
1 China 74.9 107.1 182.0 38.5% Broad product range and highly diversified destination markets
2 Bangladesh 23.6 22.1 45.7 9.7% Strong ready-made-garment base, especially for European and North American buyers
3 Viet Nam 20.2 22.5 42.7 9.0% Integrated export manufacturing serving Asia, North America and Europe
4 Italy 16.8 20.8 37.6 7.9% High-value fashion, specialized manufacturing and intra-European trade
5 Germany 13.8 22.5 36.3 7.7% Large European distribution and re-export hub
6 Türkiye 18.3 14.8 33.1 7.0% Short-lead-time supplier for Europe and nearby markets
7 India 8.9 22.8 31.7 6.7% Cotton, home-textile and apparel supply capabilities across major regions
8 France 9.9 15.8 25.7 5.4% European trading, distribution and higher-value apparel activity
9 Spain 10.3 14.0 24.3 5.1% Major European apparel distribution and retail-supply base
10 Indonesia 6.5 7.3 13.8 2.9% Diversified production base with strong Asian and North American links
Total for listed economies 473.2 100.0% Rounded values
Data and methodology: Export values are rounded to the nearest US$0.1 billion and represent the combined merchandise exports reported under HS Chapter 61 (articles of apparel and clothing accessories, knitted or crocheted) and HS Chapter 62 (articles of apparel and clothing accessories, not knitted or crocheted) for 2022. The table is designed for country-level market mapping and excludes company and brand-level data.
Sources: World Trade Organization (WTO) Statistics Database and United Nations UN Comtrade Database. Differences may occur because of reporting practices, re-exports, valuation methods, rounding and revisions.

Comparing Production Capacity Across the ILO’s 60-Million-Worker Industry

Top Apparel Export House for Global Buyers?

The apparel industry employs about 60 million workers worldwide, according to widely cited ILO industry estimates. That scale makes production capacity difficult to compare. A large workforce does not automatically mean faster delivery or better consistency. Capacity depends on sewing lines, skilled operators, fabric access, machinery, and production planning.

During factory evaluations, buyers should inspect more than monthly unit figures. A reliable export house can explain its active lines, average utilization, peak-season limits, and backup arrangements. For example, one facility may operate 30 lines but reserve several for complex garments. Another may run fewer lines with stronger automation and shorter changeover times. The second facility could deliver more usable capacity for smaller, varied orders.

Worker allocation also matters. Stable teams usually reduce rework and training delays. Technical supervisors, quality inspectors, and maintenance staff influence output every day. Production records should match floor observations, shipment history, and independent audit findings. Numbers need evidence.

Capacity data is rarely perfect. Orders fluctuate, labor availability changes, and fabric delays can reduce real output. I have found that optimistic spreadsheets often hide these limits. A serious comparison should therefore review peak-season performance, defect rates, overtime controls, and on-time shipment records. Buyers should ask for recent, verifiable data rather than relying on impressive annual totals. Small details matter.

Auditing Quality and Compliance Through ISO 9001 and OEKO-TEX Standards

Top Apparel Export House for Global Buyers?

A reliable apparel export house should prove quality through repeatable systems, not attractive samples alone. ISO 9001 helps organize purchasing, production, inspections, corrective actions, and customer feedback. During an audit, buyers should review controlled procedures and recent improvement records. They should also compare inspection results with delivered garments.

OEKO-TEX certification adds a closer look at textile safety. It can verify tested materials against harmful substance requirements under the applicable certification scope. Auditors may examine fabric certificates, dyeing records, supplier declarations, and laboratory reports. A practical check starts with the fabric roll. The shade, composition, and certificate details should match the production order. Small mismatches matter.

Factory visits reveal details paperwork cannot show. Inspectors can observe needle control, measurement checks, humidity, storage conditions, and final packing. Worker training records should support what happens on the production floor. Still, audits are not magic. A clean file may hide a weak routine, while a minor record gap may reflect poor administration rather than unsafe production. This requires judgment. I would ask for evidence from several production lots, not one carefully prepared example. Continuous review remains necessary because suppliers, materials, and processes change.

Top Apparel Export House for Global Buyers? — Auditing Quality and Compliance Through ISO 9001 and OEKO-TEX Standards

This comparison shows the formal structure of two widely used compliance frameworks. ISO 9001:2015 is organized around seven auditable requirement groups, while OEKO-TEX® STANDARD 100 defines four product classes based on intended contact with the skin. The figures describe framework coverage, not the performance of any individual company.

Reference basis: ISO 9001:2015 Clauses 4–10 and OEKO-TEX® STANDARD 100 Product Classes I–IV.

Ranking Export Houses by Cost, MOQ, Lead Time, ESG, and Delivery Data

Top Apparel Export House for Global Buyers?

A credible export-house ranking should compare more than quoted unit cost. Cost per garment must include fabric loss, sampling, testing, packaging, and payment terms. MOQ matters too: a 500-piece trial order may reveal production discipline better than a 20,000-piece promise. Lead time should be measured from approved sample to port handover, not from the first inquiry. The World Bank’s 2023 Logistics Performance Index evaluates customs, infrastructure, shipment reliability, tracking, and timeliness. These factors directly affect delivery risk.

ESG scoring needs evidence, not polished claims. Request recent audit dates, wastewater records, worker-safety training, energy data, and material certificates. Textile Exchange’s 2024 Materials Market Report estimated polyester at about 57% of global fiber production in 2023. Recycled polyester represented only a smaller share, showing why material claims require verification. A factory with lower carbon intensity may still struggle with minimum order flexibility or consistent shade matching.

Delivery data should include on-time shipment percentage, average delay days, defect rates, and corrective-action closure time. Compare at least six months of records across similar products. Data can be incomplete. That is the uncomfortable part. A perfect score may indicate selective reporting rather than perfect performance. My practical ranking would weight cost at 25%, MOQ at 15%, lead time at 20%, ESG evidence at 20%, and delivery reliability at 20%. Buyers should adjust these weights by category, season, and cash-flow pressure. A low-cost supplier is not necessarily the safest supplier.

FAQS

How can buyers define an apparel export house accurately?

Check the product classification, factory equipment, test reports, and shipment records.

What do HS 61 and HS 62 generally describe?

HS 61 covers knitted or crocheted garments. HS 62 covers non-knitted garments.

Why should buyers inspect machinery before placing an order?

Knitted sportswear and woven trousers require different needles, machines, and seam settings.

How should production capacity be compared between factories?

Review active sewing lines, operator skills, utilization rates, and peak-season limits.

Does a larger workforce guarantee faster delivery?

No. Capacity also depends on planning, fabric availability, maintenance, and changeover time.

What costs should be included when comparing suppliers?

Include fabric loss, sampling, testing, packaging, payment terms, and transportation handling.

How can buyers evaluate a supplier’s minimum order quantity?

Request a manageable trial order, such as 500 pieces, when practical.

What evidence supports a credible ESG evaluation?

Review safety training, wastewater records, energy data, material certificates, and recent audit findings.

How should delivery reliability be measured?

Compare at least six months of on-time shipments, delay days, defect rates, and corrective-action closure.

Can trade statistics alone identify the best export house?

No. Trade data can reveal export consistency and product categories.

Conclusion

Choosing the right Apparel Export House requires more than comparing product catalogs or quoted prices. This article explains how to define an export house through WTO product classifications and use WTO and UN Comtrade trade data to understand global clothing flows, market demand, and export performance. It also considers production capacity within the ILO’s approximately 60-million-worker apparel industry, helping buyers evaluate whether a supplier can support consistent volume and long-term programs.

The assessment goes beyond capacity by reviewing quality systems, product safety, and responsible sourcing through ISO 9001 and OEKO-TEX standards. Export houses are compared using practical criteria, including cost competitiveness, minimum order quantities, lead times, environmental and social governance, and delivery reliability. Together, these factors provide global buyers with a structured, transparent method for identifying capable partners that can meet commercial expectations while maintaining consistent quality, compliance, and dependable international fulfillment.

Emma

Emma

Emma is a skilled marketing professional with a deep understanding of our company’s products and mission. With years of experience in the industry, she is adept at creating compelling content that not only engages our audience but also showcases the unique advantages of our offerings. Emma......